
Traffic Simulator
Background
In this project we will implement a simple traffic simulator and collect data from running it. More realistic and thus also more complex simulators, which work similar to the one we will implement, are being used, for example, to inform the choice of layouts for roads and junctions as well as to design signalling plans for traffic lights and schemes for variable speed limits. In our simplified simulator roads consist of connected segments. Akin to railway signalling, each block can either hold no car or exactly one car. We assume that all roads are one-way only. In other words the simulator will be based on a directed graph consisting of connected nodes representing the road network.
Example
The figures below show a simple example of such a network. It shows the road network with some cars on it.
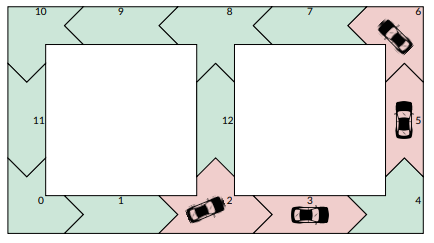
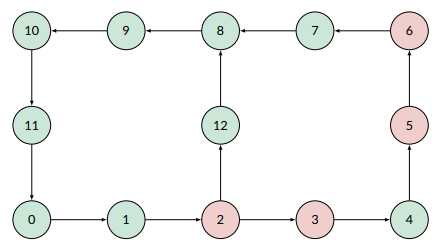
In a slightly more abstract way we can represent this network as a directed graph. Each node in the graph represents a road
segment. Red nodes in the graph represent nodes with a car and green nodes represent nodes without a car.
Details
Road network
In the ZIP file for the project there are two CSV files, which contain a more complex example layout of a traffic network.
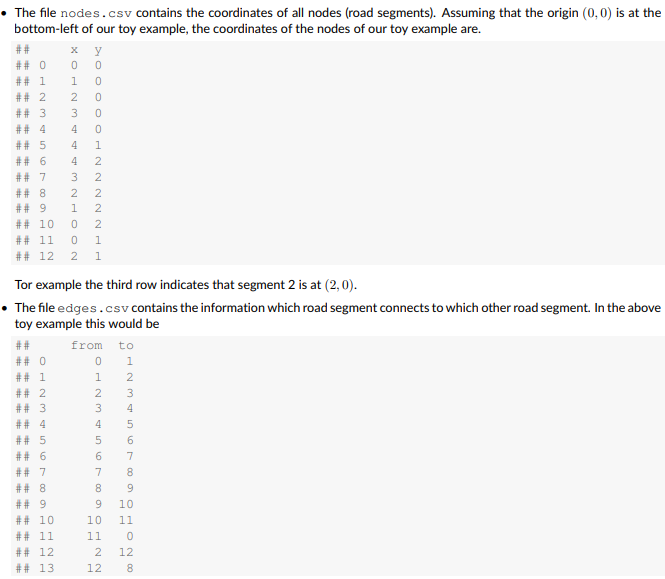
For example, the third row indicates that segment 2 connects to segment 3, i.e. a car which is currently in segment 2 can move to segment 3. Segment 2 also connects to segment 12 as seen in the second-last row.
Simulation
The simulation is now carried out as follows.
For every (simulated) minute the simulator should run the following steps:
For every (simulated) second within the minute perform the following steps (60 times per simulated minute).
“Birth” of cars In every unoccupied road segment randomly set the state to “occupied” with probability p_birth. This represents cars joining the road network from properties, parking lots or parts of the road network that we do not simulate.
“Death” of cars In every occupied road segment randomly set the state to “unoccupied” with probability p_death. This represents cars exiting the road network to properties, parking lots or parts of the road network that we do not simulate.
Flowing traffic For every occupied road segment, move the car on to the next segment if it is free, i.e. set the state of the current segment to “unoccupied” and set the state of the selected segment to “occupied”. If there is more than one segment the current segment connects to (“junction”), then randomly choose one of the segments it connects to. If this segment is occupied, do nothing. If this segment is unoccupied, move the car on to this segment.
For this step you should process the road segments in a random order. Otherwise merging of traffic does not happen in turn.
Let’s illustrate this process using the example shown on the first page.
– Imagine we chose segment 6 to be updated. In this case we would move the car to segment 7 and segment 6 would become unoccupied. – Imgaine we chose segment 5 instead. The only segment it leads into is segment 6, which is currently occupied, so we would not take any action.
– Imagine we chose segment 2 instead. We would then, with a probability of 50% move the car to segment 12, or, with a probability of 50%, leave the the car in segment 2 as segment 3 is currently occupied.
For every minute and every segment, your simulation should also collect the following summary statistics.
Occupancy Proportion of seconds of this minute during which this road segment was occupied.
Flow Number of times (during this minute) this road segment changed its state from “occupied” to “unoccupied” (depending on what is easier in your approach, you can either include the “death” of vehicles in this or not, if p_death is small this does not make a huge difference).
Implementation
Implement a class Network representing this traffic network.
• The class should be able to construct the network from the information in the files described above.
• There should be a method called run with takes the number of minutes, p_birth (default 0.001) and p_death (default 0.001) as arguments and which carries out the simulation as described above.
• There should be a method called plot network, which creates a plot of the network in its most recent state, as shown below. Occupied segments should be shown in red and unoccupied segments should be shown in green.
• There should be a method called plot occupancy, which takes one ore more segment indices as argument(s) and which creates a line plot of the evolution of occupancy for each of these segments over time, as shown below. Each line should correspond to a segment.
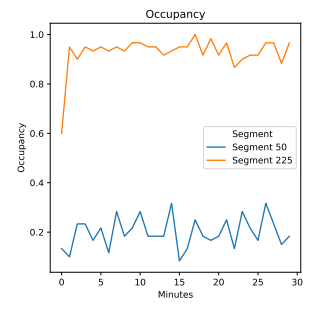
If you store the occupancies in a data frame or array such that rows correspond to minutes and columns correspond to segments, then you need to create a line plot of the corresponding columns against time.
• There should be a method called plot flow, which takes one ore more segment indices as argument(s) and which creates a line plot of the evolution of flow for each of these segments over time, as shown below. Each line should correspond to a segment.
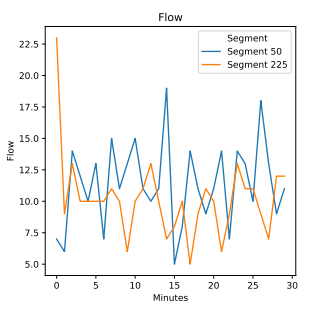
If you store the flow in a data frame or array such that rows correspond to minutes and columns correspond to segments, then you need to create a line plot of the corresponding columns against time.
• There should be a method called plot fundamental diagram, which takes a minute as argument and which creates a scatter plot of the flow against occupancies observed at that minute, as shown below. Each point in this plot corresponds to a segment.
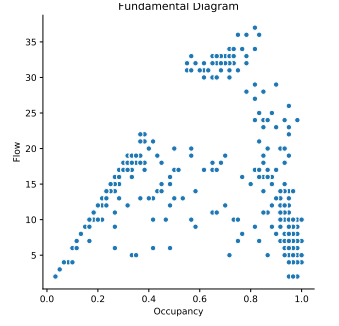
If you store the occupancy in a data frame or array and the flow in a data frame or array such that rows correspond to minutes and columns correspond to segments, then you need to create a scatter plot of one row of the flow array against the corresponding row of the occupancy array. All methods should check whether the arguments provided are valid and raise a suitable exception otherwise.